As of April 2026, hundreds of millions of chickens and other poultry have been killed due to bird flu globally, with the precise number depending heavily on the time period and region you are asking about. The short answer for the current H5N1 outbreak era (roughly 2021 to present) is that cumulative global poultry losses are well into the hundreds of millions. WOAH's single-period situation reports capture snapshots along the way: for example, Situation Report 70 recorded approximately 3.
How Many Chickens Were Killed Due to Bird Flu: Counts Explained

Maya Chen
15 Apr 2026
76 million poultry birds that died or were culled within just its covered reporting window. For a longer baseline, WOAH data covering 2005 to 2020 documented 246 million poultry that died or were culled globally. The current outbreak has already surpassed historical norms, so whichever number you are looking for, this article will show you exactly where to find it and how to interpret it correctly.
Global vs. country-level counts: why there is no single number

There is no single, universally accepted live-counter for bird flu poultry deaths, and that is by design rather than by accident. Global figures come from WOAH (the World Organisation for Animal Health), which aggregates data submitted by member countries through its World Animal Health Information System (WAHIS). FAO cross-references this with its own surveillance platform, EMPRES-i. The CDC references WOAH data when reporting on the global poultry situation to U.
S. audiences. Country-level agencies, like USDA APHIS in the United States and CFIA in Canada, publish their own national tallies independently. Because each country reports on its own schedule and uses slightly different metrics, global totals are always composite estimates, not a single verified audit.
If you want a U. S. -specific number, go to USDA APHIS. For Canada, CFIA publishes a province-by-province breakdown.
For Europe, your national veterinary authority feeds into the European Food Safety Authority database. For the rest of the world, WOAH situation reports are the most reliable aggregated source.
What 'killed' actually means in outbreak reports
When you see a headline saying X million chickens were 'killed' by bird flu, the number almost always includes birds that were deliberately depopulated, not just birds that died from the disease. Official reporting typically bundles three distinct outcomes into one figure, and understanding the difference matters for interpreting the scale of the crisis accurately.
- Died from the virus: Birds that succumbed to infection before any intervention. Highly pathogenic avian influenza (HPAI) can kill up to 90 to 100 percent of an affected flock within days, so in fast-moving outbreaks these deaths can be substantial.
- Humanely culled or depopulated: Birds on an infected premises that are killed by authorities as a disease-control measure, even if they appear healthy at the time. This is the dominant category in most outbreak tallies. The UK government, for example, is explicit that 'all poultry on the premises will be humanely culled' once a case is confirmed at a commercial farm.
- Destroyed: A broader term sometimes used when birds are killed and disposed of as part of a stamping-out operation, often used interchangeably with 'depopulated' in official documents. CFIA's reporting defines its metric as domestic birds that 'died from the virus' plus domestic birds that were 'humanely depopulated by the CFIA,' making the combined nature of the count transparent.
WOAH's own situation reports use the phrase 'died or were culled' to capture this combined reality. So when you see a number like 3.76 million in a single WOAH report period, that figure is not exclusively birds that died of illness. The vast majority were almost certainly culled as a preventive containment measure. This is worth keeping in mind when assessing media coverage, which often uses 'killed by bird flu' in a way that blurs this distinction. If you are also asking how many people died from bird flu, you can check human case reporting from WHO and national public health agencies rather than poultry-death tallies.
Time framing: this year, the current outbreak, and all-time totals

The answer to 'how many chickens have been killed by bird flu this year' will be a different number depending on which time frame you mean, and official sources use at least three distinct windows.
| Time Frame | What It Covers | Where to Find It |
|---|---|---|
| Current reporting period | Birds lost during the specific window of a single WOAH situation report (typically weeks to a few months) | WOAH HPAI Situation Reports (e.g., Report 70 showed ~3.76 million for its period) |
| Current calendar year (e.g., 2026 YTD) | Birds lost since January 1 of the current year | USDA APHIS (U.S.), CFIA (Canada), national veterinary agencies, WOAH cumulative tables |
| Current outbreak era (2021–present) | Cumulative losses since the re-emergence of H5N1 clade 2.3.4.4b | WOAH cumulative totals, FAO global situation updates |
| Historical baseline (2005–2020) | 246 million birds died or culled per WOAH data | WOAH disease page, FAO archives |
WOAH publishes numbered situation report PDFs that each cover a stated time window and then update with the next report. Situation Report 78, for example, is a newer snapshot than Report 70 and will show different period and cumulative totals. The reports include trend tables and figures organized by date range, so you can track whether outbreak activity is accelerating or slowing. This is why a number you read in a news article from three months ago may look very different from the current official figure.
How these totals are actually calculated
Poultry loss totals are compiled through a chain of reporting that starts at the farm and ends at international surveillance databases. Here is how that chain works in practice. When a flock tests positive for HPAI, the farmer or veterinarian notifies the national veterinary authority, which then triggers a formal outbreak report. In the U.
S. , that report goes to USDA APHIS under national reporting regulations. APHIS maintains formal case definitions to classify what counts as a confirmed detection, and those definitions matter because a number can change as confirmatory lab results come in or as additional birds on nearby premises are tested. National authorities then submit their outbreak notifications to WOAH through WAHIS, and [WOAH validates and aggregates these into its situation reports](https://www.
woah. org/en/dise). FAO runs its own global tracking on top of WOAH data, cross-checking with national authorities and its EMPRES-i database to produce regional summaries. The result is a system that is comprehensive but not instantaneous: there is always a lag between a flock being depopulated and that flock appearing in a published global total.
Where to find the latest official numbers right now

Rather than relying on news articles, go directly to the official dashboards. Here are the most reliable sources, organized by geography.
- WOAH HPAI Situation Reports: Go to the WOAH website and search for the most recent numbered HPAI situation report. These are updated periodically and include both period-specific and cumulative global poultry loss data. Always check the 'as of' date on the report you are reading.
- FAO Global AIV Situation Update: FAO publishes a global avian influenza update page that draws on WOAH and national authority data. It provides regional breakdowns and is useful for comparing outbreak intensity across continents.
- USDA APHIS (United States): APHIS maintains a dedicated HPAI response page with confirmed-case tables, state-by-state breakdowns, and flock-size data. This is the authoritative source for U.S. poultry losses.
- CFIA (Canada): The Canadian Food Inspection Agency publishes a province-by-province table of birds impacted, with a running total and a clearly labeled 'as of' date.
- UK GOV.UK Bird Flu Page: England's situation page lists individual premises where HPAI has been confirmed and notes when culling has been carried out, giving a premise-level picture rather than a single aggregate.
- CDC Current Bird Flu Situation in Poultry: The CDC's poultry situation page summarizes the U.S. and global context for a general audience and references WOAH as the international data source.
When you visit any of these sources, note three things: the 'as of' date, whether the figure is for a specific reporting period or cumulative, and whether it covers poultry broadly or chickens specifically. Most official sources count all domestic poultry together (chickens, turkeys, ducks, etc.) rather than breaking out chickens alone, so if you need a chicken-only figure, you may need to look for species breakdowns within outbreak tables, which are not always published at the global level.
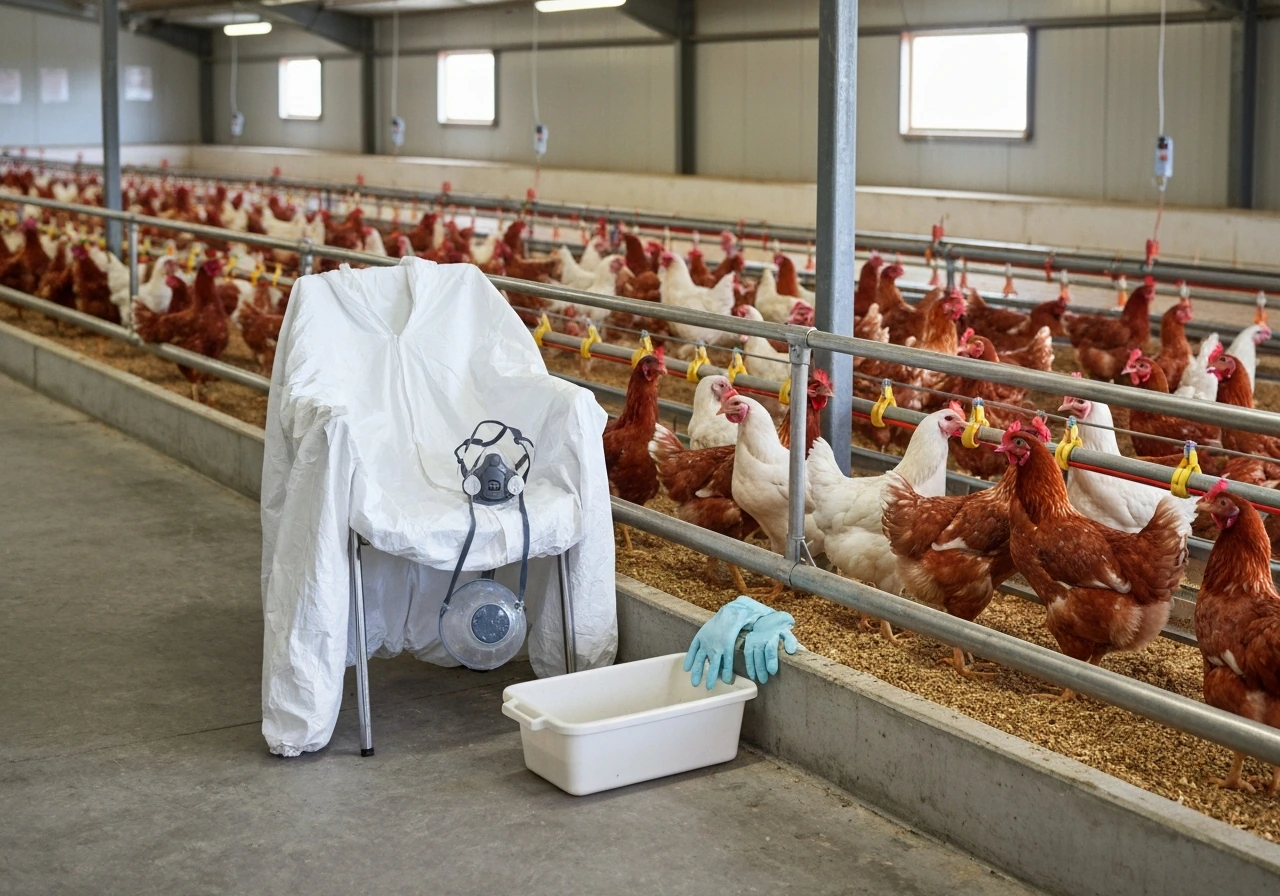
Why culling happens and what becomes of the birds
Culling is not punitive or arbitrary. It is the cornerstone of the 'stamping out' strategy that animal health authorities worldwide have used for decades to stop HPAI from spreading. The logic is epidemiological: HPAI spreads rapidly between birds through direct contact and through contaminated equipment, feed, water, and even air inside a facility. Once a flock is confirmed positive, every bird on that premises is a potential amplifier and spreader of the virus.
Removing the entire flock eliminates the viral reservoir at that location and dramatically reduces the risk of spread to neighboring farms. The UK's approach illustrates the standard: when HPAI is confirmed at a commercial premises, all poultry on the site are humanely culled as an immediate containment step, and a protection zone is established around the site.
As for what happens to the birds afterward: culled flocks are typically disposed of on-site or at licensed facilities through methods such as composting, burial in approved sites, incineration, or rendering. The goal is to prevent the carcasses from becoming a secondary source of viral spread, particularly to wild birds. Culled birds do not enter the food supply. Importantly, if you are wondering about the scale of impact on how many farms have bird flu at any given moment, the number of affected premises drives the total bird count more than the average flock size, which is why a single large commercial operation being hit can add millions to the running total overnight.
The uncertainty problem: why the numbers keep changing
Every published total comes with a hidden asterisk, and acknowledging that is not alarmism. It is just accurate. There are several reasons why the number you see today may differ from the number published next week.
- Reporting lag: Countries submit outbreak data to WOAH on their own timelines. A flock depopulated today may not appear in a WOAH situation report for days or weeks, depending on when national authorities finalize their notification.
- Confirmation delays: A suspected outbreak may trigger immediate depopulation, but the birds do not officially count until lab confirmation comes back. USDA APHIS's formal case definitions govern when a detection is classified as confirmed, and that classification can shift as diagnostic results are finalized.
- Underreporting in smallholder systems: In countries with large backyard and small-farm poultry sectors, deaths and culls outside of commercial operations are frequently underreported or not reported at all. Global totals almost certainly undercount losses in these settings.
- Retroactive corrections: When an outbreak is traced back to an earlier date than initially reported, or when additional premises are linked to a cluster, historical totals can be revised upward.
- Rounding and aggregation: WOAH and FAO present rounded figures that may smooth over smaller flocks or combine partial-period data, so apparent precision (like '3.76 million') can mask a range of uncertainty.
The practical implication: treat any number you read as a lower-bound estimate that is accurate within a margin of days to weeks. For fast-moving outbreak periods, the true total is likely higher than what is published at any given moment. For calmer inter-season periods, the published figure is probably close to accurate because most reports have been validated and submitted. You can track whether the outbreak is expanding or contracting by comparing successive WOAH situation report periods side by side.
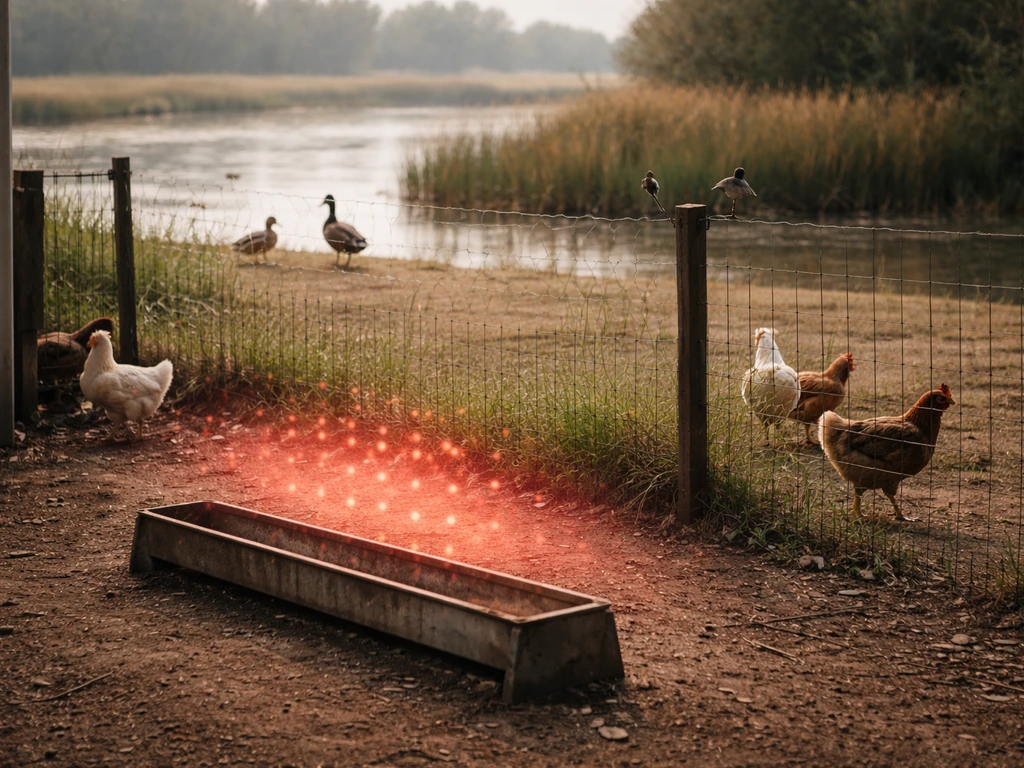
It is not just chickens: the broader picture
While chickens dominate commercial poultry counts, the current HPAI outbreak has spread far beyond the barnyard. Wild bird populations have been devastated, with mass die-offs recorded across multiple continents. If you have seen news about dozens of bald eagles that have died from bird flu, that is part of the same outbreak affecting commercial flocks. The virus has also crossed species barriers in ways that were historically rare: dairy cattle in the U.
S. have been infected, and you can read more about the scale of that in coverage of how many cows have bird flu. This broader host range is one reason surveillance has intensified and why which farms are affected by bird flu has become a more complex question than it was in previous outbreak cycles.
What this means for people: reassurance grounded in data
The scale of animal losses is genuinely alarming from an agricultural and ecological standpoint. But for most people reading this, the practical question is: what does this mean for me? The honest, evidence-based answer is that the human risk from the current HPAI situation remains low for the general public. The number of confirmed human cases globally is very small relative to the billions of birds affected. To understand how many people have bird flu at any given point, the figures are consistently in the dozens to low hundreds globally, not the thousands. Risk is concentrated among people with direct, unprotected contact with infected animals, particularly poultry farm workers and those handling sick or dead birds.
The human health picture has been tracked closely because the concern is not just current infections but future pandemic potential. Researchers and public health officials continuously model what a larger outbreak could look like. Coverage on how many people would die in a bird flu pandemic puts that risk in perspective, and it is genuinely important context for understanding why authorities respond so aggressively to animal outbreaks, even when current human case counts are low. Information on who has died from bird flu historically shows that fatalities have been heavily skewed toward people in close contact with poultry in high-risk settings, and similarly how many people have died from bird flu overall remains a small fraction relative to the enormous number of birds lost.
On food safety: properly cooked poultry and eggs are safe. No confirmed human infection has ever been linked to eating thoroughly cooked food. The risk pathway is direct contact with live or recently dead infected birds, not the food supply after standard processing and cooking. The commercial culling response, while disruptive to supply chains and prices, is precisely what keeps the food system safe by removing infected animals before they reach processing.
Your practical next steps
If you want the most current, verified number of chickens killed due to bird flu, here is exactly what to do. If you are trying to pinpoint which farms are affected by bird flu in your region, focus on confirmed-premises listings in the most recent national reports and cross-check them against the latest WOAH situation report. For global totals, pull the most recent WOAH HPAI situation report, note its 'as of' date, and use the 'died or were culled' figure for whichever time window matches your question. For the specific reporting window covered by WOAH Situation Report 71, about 2. 39 million poultry birds died or were culled [the 'died or were culled' figure](https://www.
woah. org/app/uploads/2025/06/hpai-report-71. pdf). For U.
S. totals, go to USDA APHIS's HPAI response page and look for the confirmed-case table with flock-size data. For Canada, CFIA's province-by-province table gives you a running total. For any other country, check your national veterinary authority's website first, then cross-reference with WOAH.
Always note whether you are looking at a period total or a cumulative total, and whether the figure covers all poultry or just chickens. If a news article gives you a number without a date and a source, treat it as unverified until you find the original official report behind it.
FAQ
When a source says “killed” in bird flu coverage, does that mean only birds that died, or also birds that were depopulated?
In WOAH reporting, a number tied to “died or were culled” usually reflects both natural deaths and preventive depopulation, but it is still often treated as a lower-bound for “killed.” If you need the portion that is specifically deaths from infection, check whether the situation report provides a split by outcome (many do not at global level).
How can I tell whether a reported number is for a specific time window or the whole outbreak to date, and whether it covers chickens only?
To avoid mixing apples and oranges, confirm two fields: (1) whether the table is labeled as a reporting period versus cumulative total, and (2) whether it says “poultry birds” or lists a species breakdown. Many global tables include multiple poultry types, so a “chickens” question may require drilling into species-specific subtotals if available.
Why do totals sometimes jump up in later reports even if the outbreak seems to be slowing?
Use the “as of” date on the most recent WOAH situation report, then compare it with the immediately prior report to see the net change. If a number jumps later, it is typically because confirmatory testing, reclassification, or additional premises testing completed after the earlier “as of” cutoff.
What’s the biggest mistake people make when using media numbers for how many chickens were killed due to bird flu?
Headlines that omit the reporting window can be misleading because a figure from one WOAH report period is not directly comparable to a cumulative figure in another. If you cannot find the original WOAH table, treat the headline number as unverified and look for a matching “as of” and report-period label in the situation report PDF.
Could chickens that were culled locally fail to show up in global totals immediately?
Yes. Even when a global total is reported, many jurisdictions record and submit events differently, and some delays occur after depopulation when lab confirmation and premise investigations finalize. This can create a lag where birds are already culled in a region but do not yet appear in the global running total.
Is it possible to get a truly verified chicken-only number at the global level, or do I have to accept poultry-wide totals?
If you are trying to estimate chicken-only impact, look for species breakdowns at the national or regional level first (for example, national veterinary authority reporting) because the global summary may only provide broad poultry categories. If no chicken-only table exists for the period, you may need to treat chicken counts as an estimate rather than a verified number.
Why can one outbreak event add millions to the running total, even if the number of farms doesn’t seem that large?
When a large commercial facility is affected, the number can increase sharply compared with an average small-flock event. For interpreting “why millions,” compare the number of affected premises to the stated average flock size, since premise count often explains the scale more than farm-to-farm variation.
How does culling timing and disposal affect reporting and what should I know about the “killed” figures operationally?
Culling usually happens quickly after a confirmed detection to remove the viral reservoir, so disposal timing can be part of why reporting updates come in waves. While birds are not supposed to enter the food supply, carcass handling and containment protocols can vary by country, so the operational timeline can differ even when the epidemiological trigger is the same.
If I want the most current and verified number, which source should I start with for global versus U.S. chicken losses?
To locate the best figure, prioritize WOAH situation report tables for global totals, then switch to the country agency for chicken-specific needs. If you are reading a U.S. story, for example, USDA APHIS confirmed-case and flock-size tables are the place to start, not a secondary media recap of a number.
How can I quickly validate a number I see online if the article does not mention where it came from?
If a figure is reported without a date and without a recognized reporting authority, it is very likely either (a) outdated, (b) mixing period and cumulative totals, or (c) conflating “poultry birds” with “chickens.” A quick check is to see whether the number matches a specific WOAH situation report “as of” value.
Next Articles
How Many People Died From Bird Flu Today and Overall
Exact numbers on human bird flu deaths plus animals and birds, with how to interpret totals this year vs all-time.
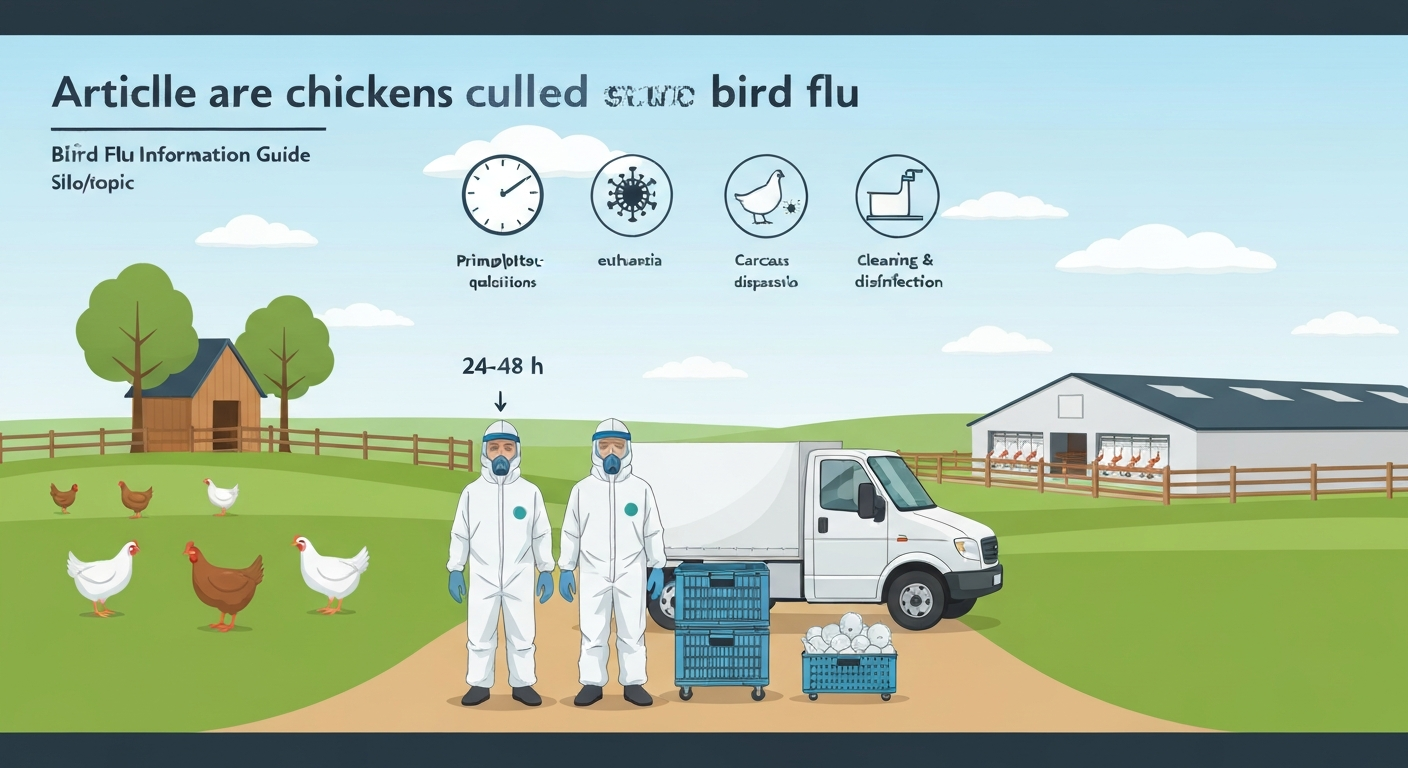
How Are Chickens Culled Bird Flu: Methods, Reasons & Steps
How are chickens culled during bird flu: why it’s done, humane methods, disposal, biosecurity, and next steps
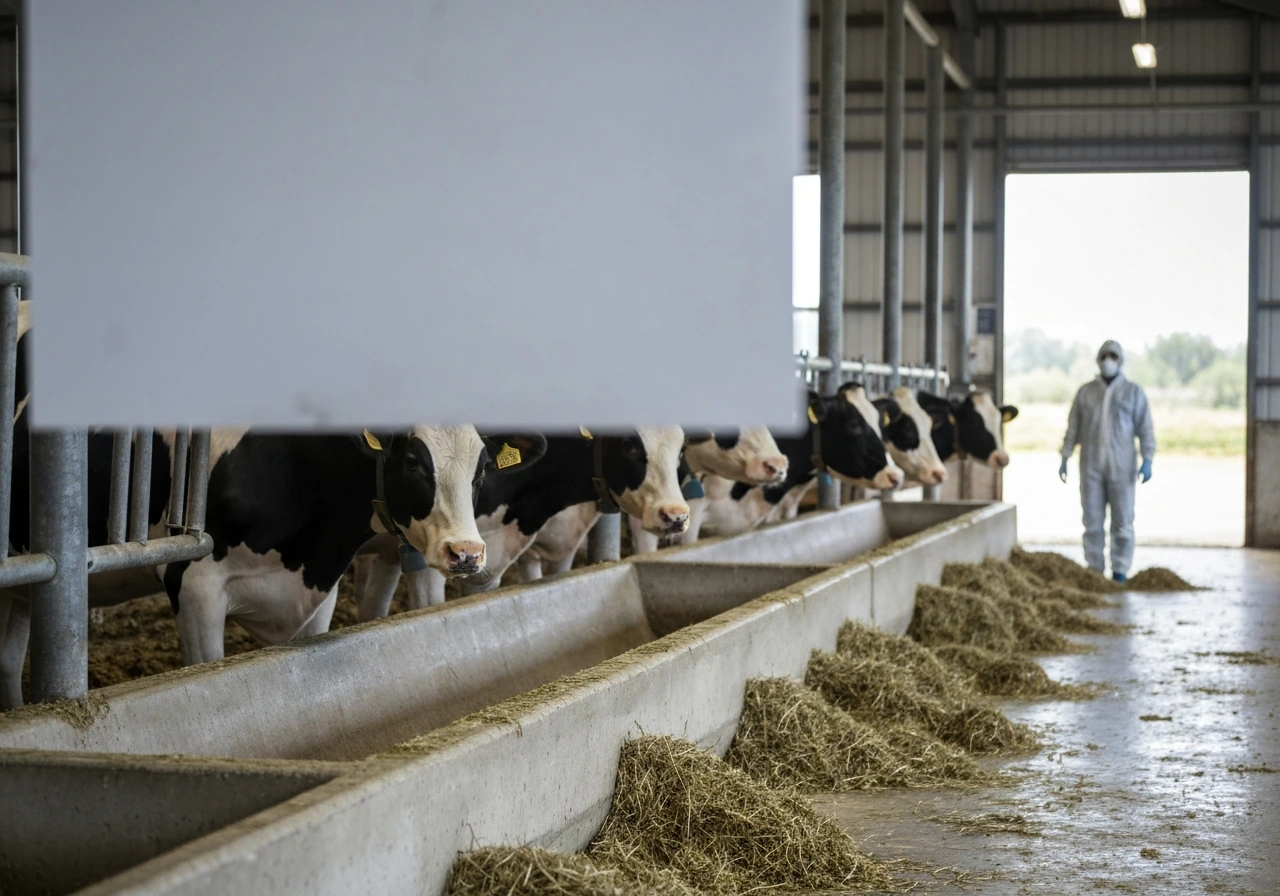
Do Cows With Bird Flu Have to Be Killed? What Happens
Explains whether cows with bird flu must be killed, and what happens for confirmed vs suspected cases, isolation and nex